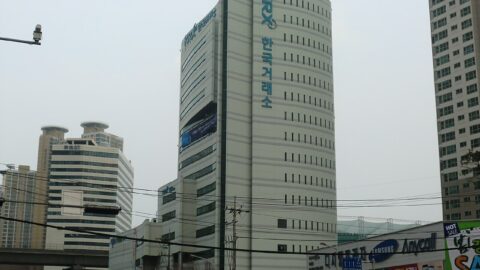
Informopedia Explains: at 12:38 on the afternoon of Thursday, October 15, traders in Seoul watched their screens go still. The KOSPI had fallen 8%, and the exchange had done the one thing markets are supposed never to do: stop. For 20 minutes, nobody could buy or sell a single Korean share. Then, just as suddenly, trading resumed. What had just happened — and why does nearly every major stock market on earth keep a button like this within reach?
Born in the rubble of Black Monday
On October 19, 1987 — 39 years ago this week — the Dow Jones Industrial Average fell 508 points, or 22.6%, in a single session. No single headline caused it: program trading and so-called portfolio insurance — funds mechanically selling futures as prices fell — turned an ordinary down day into a self-reinforcing cascade. Treasury Secretary Nicholas Brady led the official post-mortem, which recommended something radical: build an automatic brake into the market itself.
The New York Stock Exchange implemented Rule 80B in 1988. A 250-point Dow drop would halt trading for an hour; a 400-point drop would close the market for two. The idea: force everyone to stop, read the news, and meet margin calls instead of selling blindly into a falling market.
There was just one problem: the triggers were fixed in points, and markets grow. A 250-point drop was a crisis when the Dow sat near 2,000; by the time the Dow crossed 10,000 it was a quiet Tuesday. The breakers rusted unused for decades — until a 2012 rewrite replaced points with percentages of the S&P 500: 7%, 13%, 20%. Those are the rules Wall Street still uses.
The 20 minutes that changed everything: the Flash Crash
On May 6, 2010, at 2:32 in the afternoon, the Dow began to fall — and then kept falling. In about 20 minutes it shed nearly 1,000 points, roughly 9%, before snapping most of the way back. The trigger was a single $4.1 billion sell program: 75,000 e-mini S&P 500 futures contracts dumped by the mutual fund manager Waddell & Reed as a hedge. The selling cascaded through automated trading systems. For a few surreal minutes, shares of Accenture traded at a penny; Procter & Gamble fell 37% and recovered. A joint SEC-CFTC investigation later blamed no villain — just velocity. Machines selling because other machines were selling.
The Flash Crash proved the 1987 lesson still applied, only faster. It produced a new generation of safeguards for individual stocks: first five-minute trading pauses, then the Limit Up-Limit Down price bands that still govern single-name volatility today.
What a circuit breaker actually is
America’s version comes in three levels, all measured against the S&P 500’s previous close:
- Level 1 — 7% down. If it happens before 3:25 p.m. Eastern, all U.S. stock trading halts for 15 minutes. At or after 3:25, no halt — with 35 minutes left in the session, a pause would cause more chaos than calm.
- Level 2 — 13% down. Same deal: another 15 minutes, only before 3:25 p.m.
- Level 3 — 20% down. At any time of day, the market closes for the rest of the session.
Each level can fire only once per day, and the halt is market-wide: stocks, options, the lot. The thresholds are recalculated every morning from the prior close, so they scale with the market — the flaw that doomed the 1988 design. Indices are powerful things: as our explainer on what happens when a country loses its index place showed, the rules written around them move real money. The U.S. breakers have fired only five times: once on October 27, 1997, and four times in the COVID panic of March 2020 — on the 9th, 12th, 16th, and 18th.
How Korea’s version works
Seoul’s design is similar in spirit but stricter in numbers. Introduced in 1998, it also has three levels — 8%, 15%, and 20% — measured against the previous day’s close, with each stage requiring the index to sit at or beyond the line for a full minute:
- Level 1 — 8% down: a 20-minute halt. New orders are rejected; only cancellations get through. When trading resumes, a 10-minute single-price auction reopens the market.
- Level 2 — 15% down (plus a further 1% slide beyond the Level 1 trigger point): another 20-minute halt.
- Level 3 — 20% down (plus a further 1%): trading ends for the day.
Korea also runs a lighter first line of defense, the sidecar: if KOSPI 200 futures move 5% — or KOSDAQ 150 futures 6% — and stay there for a minute, program-trading orders are frozen for five minutes. The machine-driven selling pauses while ordinary trading continues. On October 15 the sidecars fired at 9:07 and 9:12 a.m.; the full circuit breakers followed at 12:23 and 12:38 p.m. Every halt in Korean market history has been Level 1 — the upper stages have never been needed. Index rules shape where global money goes — as the MSCI standoff over Indonesia showed — and Korea’s thresholds are calibrated for a market where foreign flows turn on a dime.
Why they exist: the plumbing and the psychology
The official logic, unchanged since the Brady Report, has two halves. The plumbing half: a halt gives market makers time to post fresh quotes, lets clearing systems catch up, and breaks the feedback loops — like 1987’s portfolio insurance — in which selling causes more selling. The psychology half: it forces humans back into the loop. In a crash, nobody knows whether prices are falling on news or on machinery. Fifteen or twenty minutes is time to find out which.
There is also a quieter purpose: margin. In 1987, brokers could not reach clients fast enough to collect the collateral that kept the system solvent. A pause buys the hours the plumbing needs.
The controversy: do they cause the crash they prevent?
Here is the uncomfortable question. If everyone knows trading stops at 8%, what happens at 7%? The economist Avinash Subrahmanyam formalized the worry in 1994: traders who fear being locked in will rush to sell before the halt — accelerating into the very line the breaker was built to defend. Researchers call it the magnet effect.
The evidence is genuinely mixed. Goldstein and Kavajecz documented the effect on the NYSE during the October 1997 turmoil. Studies of China’s January 2016 market-wide halts found they did not stop prices falling at all — Beijing abandoned the experiment within days. And researchers at MIT Sloan built a model showing that as prices approach the threshold, volatility rises and the probability of a trigger accelerates: “The fear of an imminent trading halt causes some investors to sell aggressively, which actually makes the market more volatile, not less.”
But the defense has data too. Other studies find breakers reduce volatility and improve price discovery, at the cost of wider bid-ask spreads — and that the magnet effect fades for very short pauses. The honest summary: circuit breakers reliably stop trading. Whether they reliably stop panics is still an open question.
What happened the last few times they fired
The modern U.S. breakers have fired five times, and none of those days marked a bottom — in March 2020 the selling resumed and the worst was still weeks away. Korea’s breakers fire far more often: 15 times this year alone across the two boards, usually on foreign-led tech selloffs like October 15’s. The pattern is consistent. A halt can slow the day’s bleeding — Seoul closed down 7.57% after touching 9.29% down — but it cannot decide where the market goes next. Seoul bounced 2% the following session; in March 2020, the recovery took far longer.
Why this matters
A circuit breaker is the financial system’s admission that markets are machines with human consequences. It works brilliantly at its literal job — no trades happen during a halt — and ambiguously at its real one, which is restoring confidence. Here is the blunt version: the breaker treats velocity, not cause. It cannot answer the question that actually crashed Seoul — whether the AI boom’s financing adds up — and no pause ever will. That is the breaker’s honest limit, and its honest value: it buys 20 minutes for humans to ask the right question.
What happens next
Watch two things. First, whether the magnet effect shows up in Seoul’s data — did selling accelerate into the 8% line on October 15, or did the morning sidecars bleed the pressure off early? Second, whether the world’s exchanges keep converging on the same design: America’s 7-13-20 and Korea’s 8-15-20 are answers to the same 1987 question, tuned to different market structures. The next crash will test both. When your screen freezes at 12:38 on some future afternoon, you will know what you are looking at: not the market failing, but the market’s emergency brake — doing exactly what it was built to do, and nothing more.